How to Read Candlestick Charts
Every candlestick packs four prices into one shape. Once you know how to read the body and wicks, you can see at a glance who was in control of each period, which is the foundation for every candlestick pattern.
The four prices in every candle
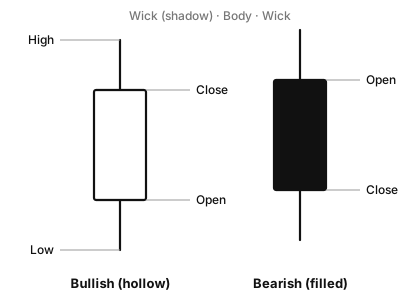
- Open: the first traded price of the period.
- High and low: the highest and lowest prices reached, shown by the tips of the wicks.
- Close: the last price of the period.
The body spans the open and close. If the close is above the open, the candle is bullish: green on most charts, or hollow in black-and-white charts like the diagrams here. If the close is below the open, it’s bearish: red, or filled.
Reading a candle’s shape
| What you see | What it tells you |
|---|---|
| Long body, short wicks | One side was in control for most of the period. |
| Small body, long wicks | Big swings but no clear winner: indecision. |
| Long lower wick | Prices below were rejected; buyers pushed back (see hammer). |
| Long upper wick | Prices above were rejected; sellers pushed back (see shooting star). |
| No body at all | Open and close equal (see doji). |
Timeframes
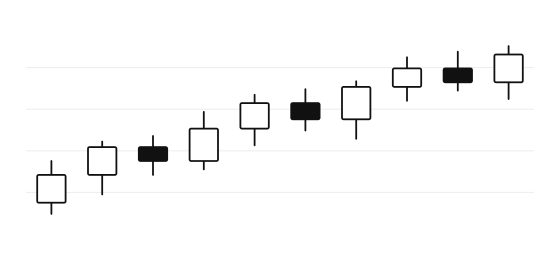
Each candle covers one period, and you choose the period. On a 1-hour chart each candle is one hour; on a daily chart, one day. A daily candle contains everything the 24 hourly candles inside it did, so the same move can look like a single long candle on a higher timeframe and a choppy sequence on a lower one.
In stock markets the daily candle covers the regular session, so there can be gaps between one day’s close and the next day’s open. Forex and crypto trade around the clock, so gaps are rare except over weekends.
Candlesticks on TradingView
- Change the timeframe with the interval menu at the top, or just type a number on the chart (for example 4 h then Enter).
- Hollow candles are a chart type option in the bar-style menu.
- Change candle colours in Chart settings → Symbol, or generate a matching theme with our chart color generator.
- See exact prices: hover over a candle and the open, high, low and close appear at the top left.
Next steps
Once you can read single candles, learn the common candlestick patterns, then the larger chart patterns.
FAQ
How do you read a candlestick chart?
What do the wicks on a candlestick mean?
What does a red candle mean?
What timeframe should I use for candlesticks?
More free TradingView tools

ChartWatch is an independent tool and is not affiliated with, endorsed by, or officially connected to TradingView, Inc. “TradingView” is a trademark of its respective owner. Exchange, broker and platform names are trademarks of their respective owners.