Trend Lines
A trend line is a sloping line that connects a series of rising lows in an uptrend, or falling highs in a downtrend. It shows the direction and angle of the trend, and acts as a moving level of support or resistance.
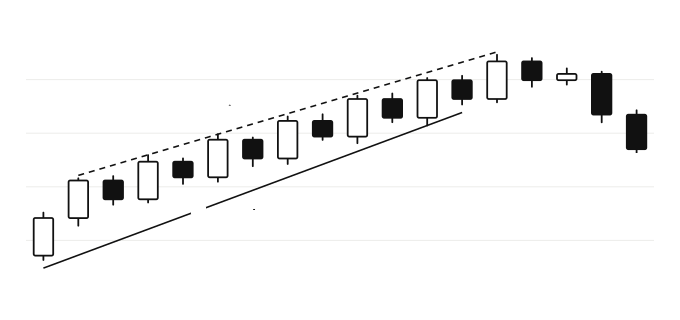
How to draw a trend line
- Identify the trend. An uptrend makes higher highs and higher lows; a downtrend makes lower highs and lower lows.
- Uptrend: connect two or more swing lows, with the line below price. Downtrend: connect two or more swing highs, above price.
- Two points draw a line; a third touch confirms it. The more times price respects the line, the more it’s watched.
- Don’t force it. If you have to cut through lots of candle bodies to make the line fit, it isn’t a useful trend line.
Channels
Draw a parallel line on the other side of price (through the swing highs in an uptrend) and you have a trend channel. Price often moves between the two lines. Flags and wedges in chart patterns are built from short channels and converging trend lines.
When a trend line breaks
A close beyond the line suggests the trend is weakening, but it doesn’t always mean it’s reversing; price can move sideways and form a new, flatter trend. Many traders wait for a close rather than an intraday poke through the line, and watch whether price then retests the line from the other side.
Steep lines break sooner
Very steep trend lines are rarely sustainable and tend to break quickly. On long-term charts with big price changes, a logarithmic price scale can give a more meaningful line than a linear one.
On TradingView
Use the Trend Line tool (Alt + T), the Parallel Channel tool for channels, and toggle log scale with Alt + L. You can set alerts on a trend line to be notified when price crosses it. More in our TradingView shortcuts.
Educational explanation only. ChartWatch is independent and doesn’t give trading or investment advice. Trading carries a risk of loss.
FAQ
How do you draw a trend line?
How many touches make a valid trend line?
What does a trend line break mean?
More free TradingView tools

ChartWatch is an independent tool and is not affiliated with, endorsed by, or officially connected to TradingView, Inc. “TradingView” is a trademark of its respective owner. Exchange, broker and platform names are trademarks of their respective owners.