Moving Average (SMA vs EMA)
A moving average smooths price by averaging it over a set number of periods, updated with every new bar. It’s the building block of many other indicators and the most common way to see the direction of a trend.
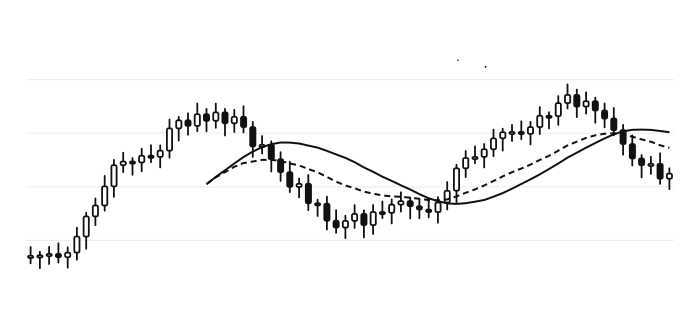
Simple moving average (SMA)
SMA = (Sum of the last N closes) ÷ N
A 20-period SMA adds the last 20 closes and divides by 20. Every bar in the window has equal weight.
Exponential moving average (EMA)
Multiplier = 2 ÷ (N + 1)
EMA = (Close − Previous EMA) × Multiplier + Previous EMA
An EMA gives more weight to recent prices, so it reacts faster than an SMA of the same length. For a 20-period EMA the multiplier is 2 ÷ 21 = 0.0952, so the latest close gets about 9.5% of the weight. Other variations include the weighted (WMA) and smoothed (SMMA) moving averages.
Common periods
| Period | Often used for |
|---|---|
| 9–21 | Short-term trend |
| 50 | Medium-term trend |
| 200 | Long-term trend, widely watched on daily charts |
How traders use moving averages
- Trend direction: a rising average and price above it suggest an uptrend.
- Crossovers: a shorter average crossing a longer one. On daily charts the 50-day crossing above the 200-day is often called a “golden cross”, and crossing below a “death cross”.
- Dynamic levels: price sometimes pulls back to a moving average in a trend.
The trade-off: lag
Because moving averages are built from past prices, they always lag. Shorter averages follow price closely but produce more false signals in choppy markets; longer ones are smoother but slower to turn.
On TradingView
Search Indicators for Moving Average (simple) or Moving Average Exponential. Moving averages also power MACD and Bollinger Bands. For a volume-weighted alternative, see VWAP.
Educational explanation only. ChartWatch is independent and doesn’t give trading or investment advice. Trading carries a risk of loss.
FAQ
What is the difference between SMA and EMA?
What is the 200-day moving average?
What is a golden cross?
How is an EMA calculated?
More free TradingView tools

ChartWatch is an independent tool and is not affiliated with, endorsed by, or officially connected to TradingView, Inc. “TradingView” is a trademark of its respective owner. Exchange, broker and platform names are trademarks of their respective owners.