Support and Resistance
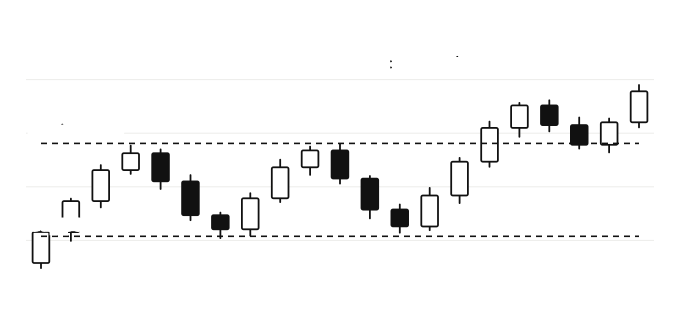
Support is a price area where falling prices have tended to stop and bounce; resistance is an area where rising prices have tended to stall. They’re the most basic and widely used idea in chart reading.
Why levels form
Markets remember prices. If buyers stepped in strongly at $100 before, many traders watch $100 again: some to buy, some to place stops just below it. That shared attention is what makes a level matter. The more times a level has held, and the more obvious it is, the more people tend to watch it.
Role reversal
When the price breaks through resistance and stays above it, that old ceiling often becomes a floor: traders who missed the breakout buy the retest. The same works in reverse for broken support.
How to draw support and resistance
- Think in zones, not exact lines. Prices rarely turn at precisely the same tick. A band around the level is more realistic.
- Start on a higher timeframe. Levels on daily or weekly charts are watched by more people than levels on a 1-minute chart.
- Look for clear turning points where price reversed sharply, and for areas where it paused several times.
- Round numbers (1.1000 on EUR/USD, $100 on a stock, $50,000 on Bitcoin) often act as levels simply because people place orders there.
- Wicks or closes? Both approaches are used. Closes ignore brief spikes; wicks show the extremes. Pick one and be consistent.
On TradingView
Use the Horizontal Line tool (Alt + H) for a level, or the Rectangle tool for a zone. A horizontal line can also have an alert set on it, so you’re notified when price gets there: see the alert builder. All hotkeys are on our shortcuts page.
Related tools
Sloping support and resistance are trend lines. Calculated levels such as pivot points and Fibonacci retracements are popular too. Candle patterns like the hammer are often watched at these levels.
Educational explanation only. ChartWatch is independent and doesn’t give trading or investment advice. Trading carries a risk of loss.
FAQ
What is support and resistance?
What happens when resistance breaks?
Should I use wicks or closes to draw levels?
Are round numbers support and resistance?
More free TradingView tools

ChartWatch is an independent tool and is not affiliated with, endorsed by, or officially connected to TradingView, Inc. “TradingView” is a trademark of its respective owner. Exchange, broker and platform names are trademarks of their respective owners.