Candlestick Patterns
The most common candlestick patterns, each with a clear diagram: what they look like, what they suggest about buyers and sellers, and what traders look for before trusting them. Start with the cheat sheet below, or pick a pattern.
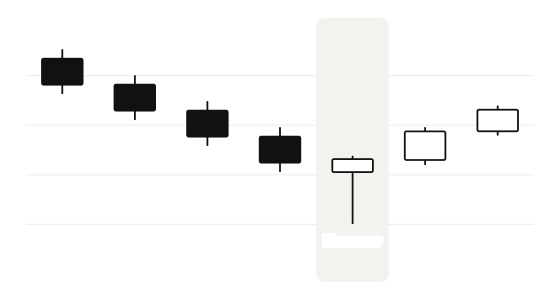 HammerLong lower wick after a decline
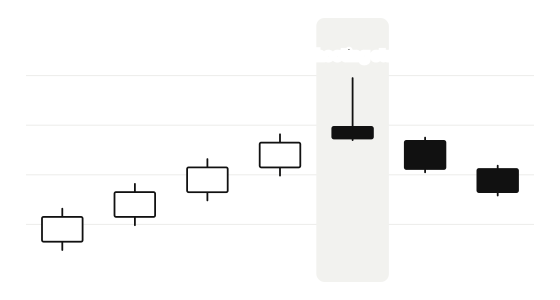 Shooting starLong upper wick after a rise
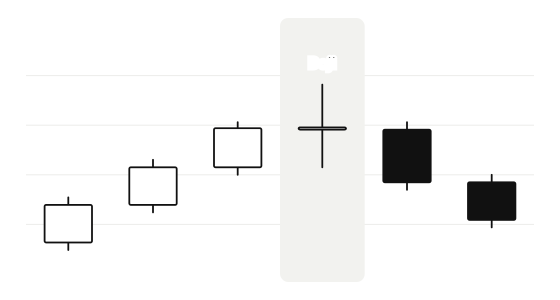 DojiOpen = close: indecision
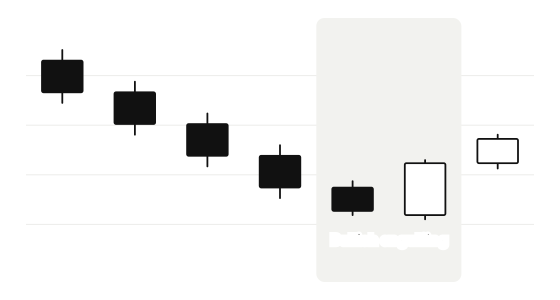 EngulfingSecond body covers the first
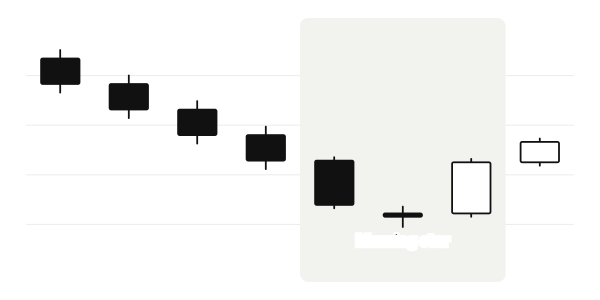 Morning starThree-candle turn (and evening star)
How a candlestick works
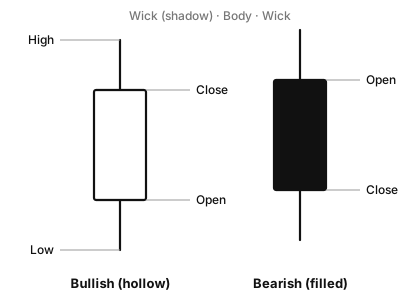
Each candle shows four prices for its time period: the open, high, low and close. The thick part (the body) runs from open to close; the thin lines (wicks or shadows) reach the high and low. On this site’s diagrams, hollow candles closed higher than they opened and filled candles closed lower; on most screens these are green and red. More in how to read candlestick charts.
Candlestick patterns cheat sheet
| Pattern | Candles | Usually read as |
|---|---|---|
| Hammer | 1 | Bullish reversal |
| Inverted hammer | 1 | Bullish reversal |
| Hanging man | 1 | Bearish reversal |
| Shooting star | 1 | Bearish reversal |
| Doji | 1 | Indecision |
| Dragonfly doji | 1 | Bullish after a decline |
| Gravestone doji | 1 | Bearish after a rise |
| Bullish engulfing | 2 | Bullish reversal |
| Bearish engulfing | 2 | Bearish reversal |
| Morning star | 3 | Bullish reversal |
| Evening star | 3 | Bearish reversal |
Single, double and triple candle patterns
- Single-candle patterns (hammer, shooting star, doji) are about the shape of one candle: where the body sits and how long the wicks are.
- Two-candle patterns (engulfing) compare a candle with the one before it.
- Three-candle patterns (morning and evening star) show a trend, a pause and a reversal.
Context matters more than the pattern
The same candle can mean different things depending on where it appears. A hammer after a long fall at a known support level gets attention; the same shape in the middle of a sideways range means little. Traders usually look at the trend before the pattern, nearby support and resistance, and the next candle for confirmation.
For larger shapes made of many candles, such as head and shoulders or flags, see chart patterns.
Finding it on TradingView
TradingView has built-in candlestick pattern indicators that mark patterns on the chart for you. Click Indicators at the top of the chart and search for the pattern name. You can also practise spotting patterns on past price action with Bar Replay, which hides the candles to the right so you can’t see what came next.
FAQ
What are candlestick patterns?
What is the most reliable candlestick pattern?
What do hollow and filled candles mean?
How many candlestick patterns are there?
More free TradingView tools

ChartWatch is an independent tool and is not affiliated with, endorsed by, or officially connected to TradingView, Inc. “TradingView” is a trademark of its respective owner. Exchange, broker and platform names are trademarks of their respective owners.