Candlestick patterns › Shooting star
Shooting Star Candlestick
A shooting star is a single candle with a small body near the bottom and a long upper wick, appearing after a rise. Buyers pushed the price up during the session, but sellers drove it back down by the close.
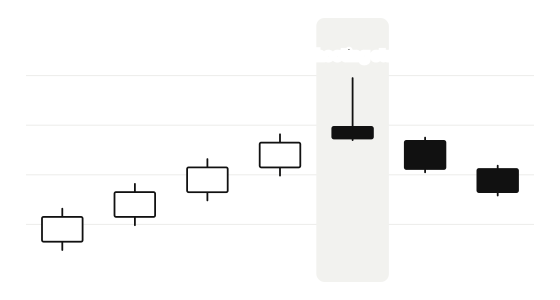
What a shooting star looks like
- It appears after an uptrend.
- A small real body near the low of the candle. It can be hollow or filled.
- An upper wick at least twice the length of the body.
- Little or no lower wick.
The long upper wick shows that higher prices were rejected: buyers took the price up, then sellers took over and closed it near the open. A filled body is usually read as slightly more bearish than a hollow one.
Confirmation
Traders often wait for the next candle to close below the shooting star’s body, and give the signal more weight at a level where sellers have appeared before, such as resistance.
Shooting star vs inverted hammer
They’re the same shape. After an uptrend it’s a shooting star (bearish); after a downtrend it’s an inverted hammer (bullish). The trend before the candle decides the name.
Finding it on TradingView
TradingView has built-in candlestick pattern indicators that mark patterns on the chart for you. Click Indicators at the top of the chart and search for the pattern name. You can also practise spotting patterns on past price action with Bar Replay, which hides the candles to the right so you can’t see what came next.
Diagrams are illustrations drawn from example prices. Hollow candles closed higher than they opened; filled candles closed lower. ChartWatch doesn’t give trading advice.
FAQ
Is a shooting star bullish or bearish?
What is the difference between a shooting star and an inverted hammer?
What is the opposite of a shooting star?
More free TradingView tools

ChartWatch is an independent tool and is not affiliated with, endorsed by, or officially connected to TradingView, Inc. “TradingView” is a trademark of its respective owner. Exchange, broker and platform names are trademarks of their respective owners.