Bollinger Bands
Bollinger Bands are three lines around price: a moving average in the middle, and an upper and lower band set a number of standard deviations away. They widen when the market is volatile and narrow when it’s quiet. They were developed by John Bollinger in the 1980s.
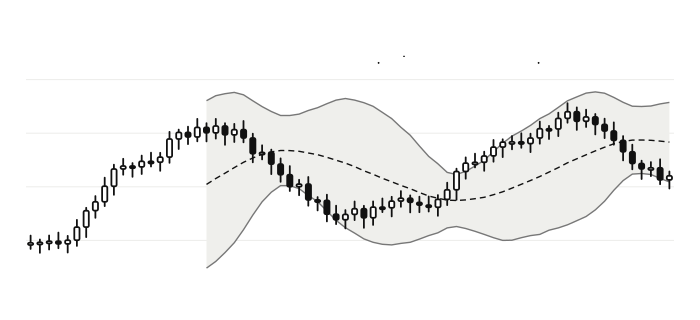
How Bollinger Bands are calculated
Middle band = 20-period simple moving average
Upper band  = Middle band + 2 × standard deviation (20 periods)
Lower band  = Middle band − 2 × standard deviation (20 periods)
Standard deviation measures how spread out recent closes are around their average. When prices swing widely, it rises and the bands move apart.
How traders read them
- Volatility: wide bands mean high volatility; narrow bands mean low volatility.
- The squeeze: when the bands become unusually narrow, it often comes before a period of bigger moves, though it doesn’t tell you the direction.
- Touches aren’t signals by themselves: in a strong trend, price can “walk the band”, repeatedly touching the upper (or lower) band.
- Mean reversion: in sideways markets, some traders watch for moves back towards the middle band.
%B and bandwidth
- %B = (Price − Lower band) ÷ (Upper band − Lower band). 1 means price is at the upper band, 0 at the lower band.
- Bandwidth = (Upper − Lower) ÷ Middle. It measures how wide the bands are, which helps spot squeezes.
On TradingView
Click Indicators and search for Bollinger Bands. They’re drawn on the price chart with a default length of 20 and multiplier of 2. TradingView also has separate Bollinger Bands %B and Bollinger BandWidth indicators. The middle band is a simple moving average.
Educational explanation only. ChartWatch is independent and doesn’t give trading or investment advice. Trading carries a risk of loss.
FAQ
What are Bollinger Bands?
What is a Bollinger Band squeeze?
Is touching the upper band a sell signal?
What are the default Bollinger Band settings?
More free TradingView tools

ChartWatch is an independent tool and is not affiliated with, endorsed by, or officially connected to TradingView, Inc. “TradingView” is a trademark of its respective owner. Exchange, broker and platform names are trademarks of their respective owners.