Chart Patterns
The classic chart patterns traders look for, each with a clear diagram: how they form, where the key line is, and when they’re considered confirmed. Reversal and continuation patterns side by side.
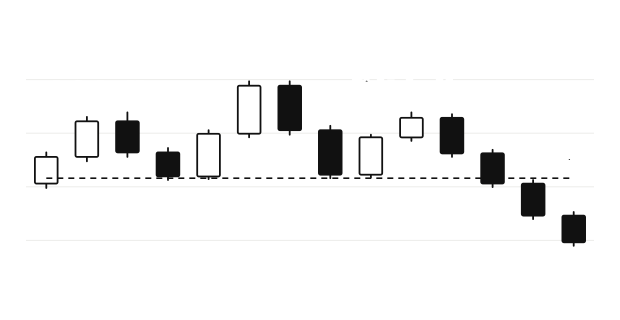 Head and shouldersThree peaks and a neckline
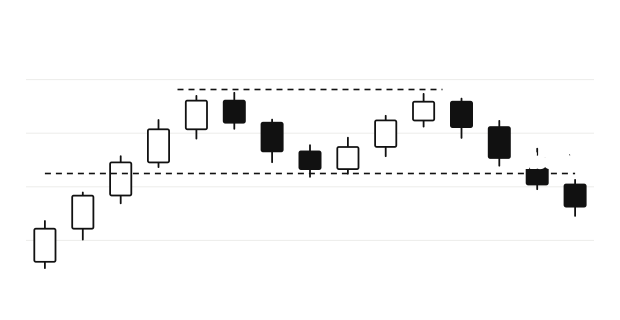 Double topM and W reversals
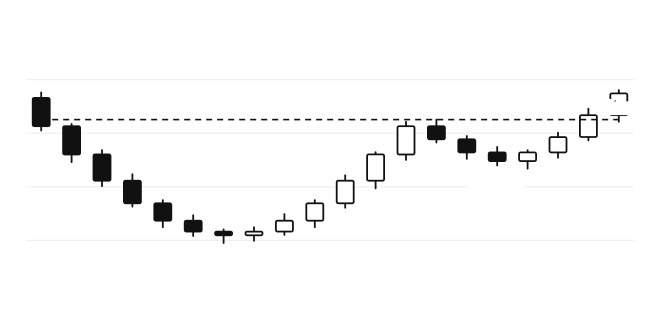 Cup and handleRounded base, small pullback
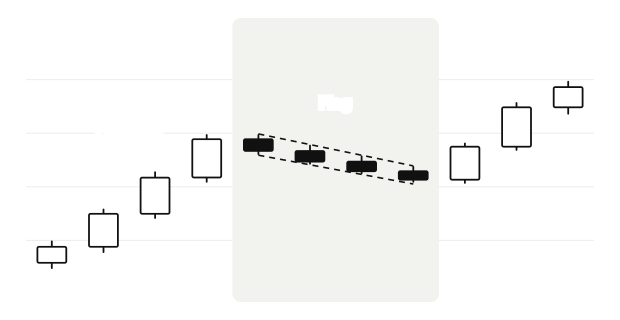 Bull flagSharp move, short pause
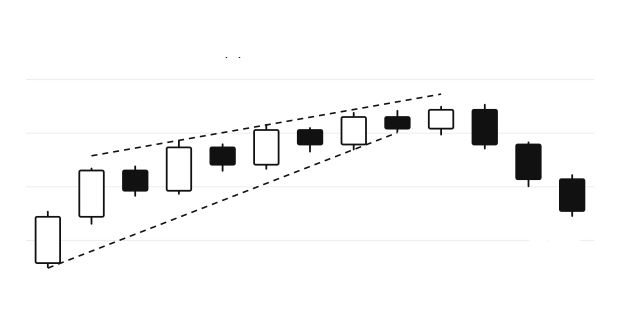 Rising wedgeConverging lines, same slope
Chart patterns cheat sheet
| Pattern | Type |
|---|---|
| Head and shoulders | Reversal (bearish) |
| Inverse head and shoulders | Reversal (bullish) |
| Double top | Reversal (bearish) |
| Double bottom | Reversal (bullish) |
| Cup and handle | Continuation (bullish) |
| Bull flag | Continuation (bullish) |
| Bear flag | Continuation (bearish) |
| Rising wedge | Usually bearish |
| Falling wedge | Usually bullish |
Reversal vs continuation patterns
Reversal patterns (head and shoulders, double tops and bottoms) suggest a trend may be ending. Continuation patterns (flags, cup and handle) suggest a pause before the trend carries on. Wedges can be either, depending on where they form.
Breakouts and confirmation
Most chart patterns are only considered complete when the price closes beyond a key line: the neckline, the rim, or the edge of the flag or wedge. Before that, the pattern is just a possibility. False breakouts, where price pokes through and then comes back, are common, which is why many traders wait for a close rather than a touch.
Chart patterns vs candlestick patterns
Chart patterns are built from many candles and describe the bigger shape of the price. Candlestick patterns use one to three candles. Traders often combine them, for example looking for a bullish candle pattern as price tests a double bottom.
Drawing it on TradingView
Use the Trend Line tool (shortcut Alt + T) for necklines and wedge lines, the Parallel Channel tool for flags, and the Patterns group in the left toolbar, which includes a head and shoulders drawing tool. Practise on past charts with Bar Replay, and see all TradingView shortcuts.
FAQ
What are chart patterns?
What is the difference between reversal and continuation patterns?
When is a chart pattern confirmed?
More free TradingView tools

ChartWatch is an independent tool and is not affiliated with, endorsed by, or officially connected to TradingView, Inc. “TradingView” is a trademark of its respective owner. Exchange, broker and platform names are trademarks of their respective owners.