Chart patterns › Double top
Double Top & Double Bottom Patterns Explained
A double top is two peaks at roughly the same price with a dip between them, like the letter M. A double bottom is the reverse, a W. Both are classic reversal patterns.
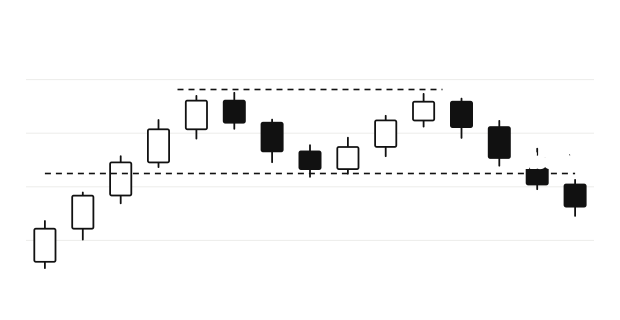
Double top
- An uptrend reaches a peak, then pulls back.
- The price rallies again but fails at about the same level as the first peak.
- The low between the peaks is the neckline. The pattern is confirmed when the price closes below it.
The two peaks don’t need to be identical; small differences are normal. What matters is that buyers failed twice at the same area, which often becomes resistance.
Double bottom
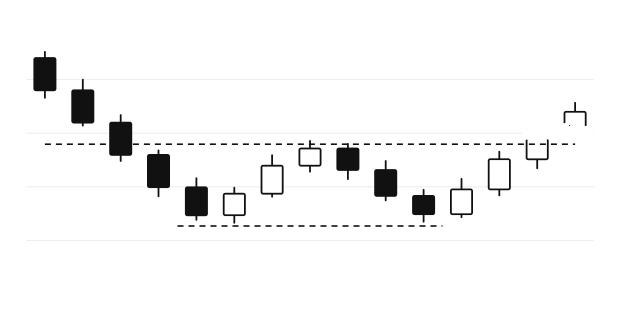
After a decline, the price makes two lows at about the same level with a bounce between them. It’s confirmed on a close above the high between the two lows.
Measured move
The traditional estimate takes the height from the peaks (or lows) to the neckline and projects it from the breakout. As with any pattern, it’s a guide only.
Triple tops and bottoms
Three tests of the same level instead of two form a triple top or triple bottom, read the same way.
Drawing it on TradingView
Use the Trend Line tool (shortcut Alt + T) for necklines and wedge lines, the Parallel Channel tool for flags, and the Patterns group in the left toolbar, which includes a head and shoulders drawing tool. Practise on past charts with Bar Replay, and see all TradingView shortcuts.
Diagrams are illustrations drawn from example prices. Hollow candles closed higher than they opened; filled candles closed lower. ChartWatch doesn’t give trading advice.
FAQ
Is a double top bearish?
What is a double bottom pattern?
Do both peaks need to be at exactly the same price?
More free TradingView tools

ChartWatch is an independent tool and is not affiliated with, endorsed by, or officially connected to TradingView, Inc. “TradingView” is a trademark of its respective owner. Exchange, broker and platform names are trademarks of their respective owners.