Candlestick patterns › Doji
Doji Candle
A doji is a candle where the open and close are at (or almost at) the same price, so it has little or no body. It shows a session where neither buyers nor sellers won.
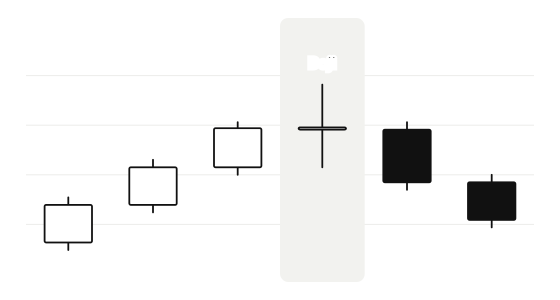
What a doji means
During the session the price moved up and down, but it finished where it started. On its own a doji signals indecision. It gets attention when it appears after a strong move, because it shows the side that was in control has stopped pushing.
Types of doji
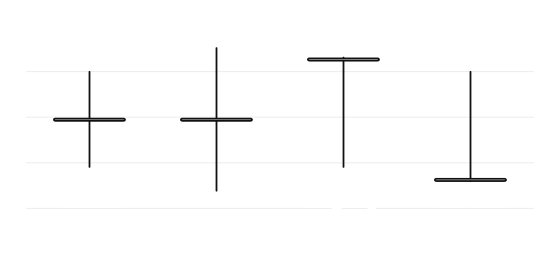
| Type | Shape | How it’s read |
|---|---|---|
| Standard doji | Open = close, wicks on both sides | Indecision |
| Long-legged doji | Very long wicks on both sides | Big swings but no winner; strong indecision |
| Dragonfly doji | Open = close = high, long lower wick | Sellers pushed down but buyers recovered everything; can be bullish after a decline |
| Gravestone doji | Open = close = low, long upper wick | Buyers pushed up but sellers took it all back; can be bearish after a rise |
| Four-price doji | Open, high, low and close all equal | No movement at all; usually very thin trading |
How close is “equal”?
Prices rarely open and close at exactly the same level, so most traders treat a candle as a doji when the body is a tiny fraction of the full range. On charts that show many decimals, such as forex, the body may be a few pipettes tall.
Doji in other patterns
A doji is often the middle candle of a morning star or evening star, where it’s called a doji star.
Finding it on TradingView
TradingView has built-in candlestick pattern indicators that mark patterns on the chart for you. Click Indicators at the top of the chart and search for the pattern name. You can also practise spotting patterns on past price action with Bar Replay, which hides the candles to the right so you can’t see what came next.
Diagrams are illustrations drawn from example prices. Hollow candles closed higher than they opened; filled candles closed lower. ChartWatch doesn’t give trading advice.
FAQ
What does a doji candle mean?
Is a doji bullish or bearish?
What is a dragonfly doji?
What is a gravestone doji?
More free TradingView tools

ChartWatch is an independent tool and is not affiliated with, endorsed by, or officially connected to TradingView, Inc. “TradingView” is a trademark of its respective owner. Exchange, broker and platform names are trademarks of their respective owners.